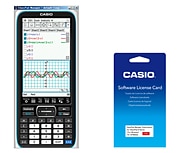
ClassPad II fx-CP400
- The colors may differ slightly from the original.
Product Overview
ClassPad II fx-CP400
3D Graph
Computer Algebra System
With CAS Graphic calculators you can use symbolic as well as numerical expressions. CAS is Computer Algebra System.
Color display
Memory : 500KB
Natural textbook display
Display expression same as textbook.
Features
∗ Comes with snap-on hard case
Vivid Color Display and Touch Panel for Superb Usability
Horizontal Screen View
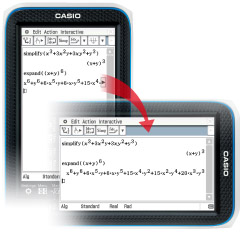
Display long formulas on a single line.
Beautiful 4.8-inch color display
©Phillip Minnis-Fotolia.com
The display has resolution of 320 x 528 pixels (more than 65,000 colors), 4.4 times higher than ClassPad 330 PLUS.
Pen-touch Operation
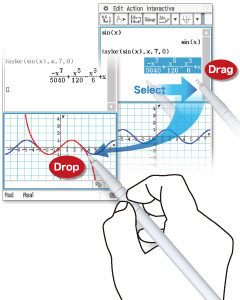
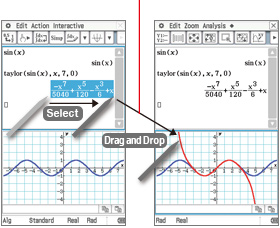
Quickly and easily create graphs using drag and drop.
Simple interface
The fx-CP400 has simple, easy-to-understand menu icons, menu bars, and toolbars and an interactive interface.
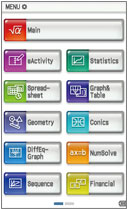
Main menu
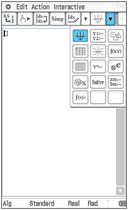
Toolbar
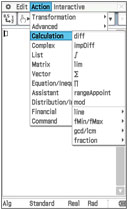
Menu bar
Interactive interface
Touch-panel operation by stylus or finger
The fx-CP400 offers intuitive stylus touch-panel operation that eliminates complicated key operations. Graphically display mathematical formulas by simply dragging and droppingthem into the graph area.
Create a graph by selecting a formula
and using drag and drop.
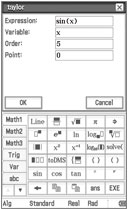
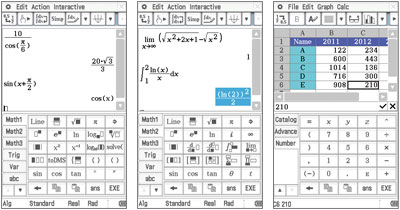
Brand-new software keyboard
The fx-CP400 supports learning of basic functions usedby everyone, such as fractions, square roots,and trigonometric functions, advanced functions likedifferential calculus, complex compound numbers, andsigma calculations, as well as highly advancedcalculations such as piecewise and user-defined formulas.
Computer Algebra System (CAS)
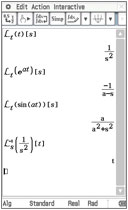
Laplace transforms
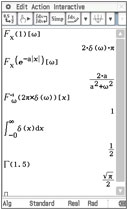
Fourier transforms
The CAS supports everything from Expand, Factor, Solve, and other basic commands to advanced commands like Fourier and Laplace transforms.
eActivity application
An eActivity is like a digital worksheet that can be created andworked with on the fx-CP400. All of the powerful features andcapabilities of the fx-CP400 can be incorporated into aneActivity. In addition to performing the same calculations asthe Main application, an eActivity will accept text entry, justlike a word processor. Graphs, as well as Geometry andSpreadsheet data, can be stored in an eActivity file.
Graph & Picture
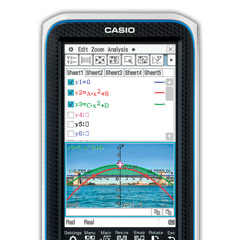
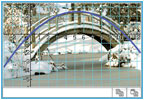
The calculator comes pre-loaded with visuals such as a single image (still image) of the curve of an arched bridge. The use of real-life visuals as background images for functionssuch as the drawing of graphs overlaid on color images makes mathematics learning a more visually familiar experience.
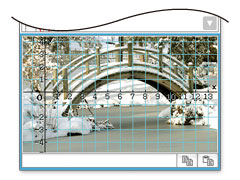
Select the formula for the graph you want to create.
![]()
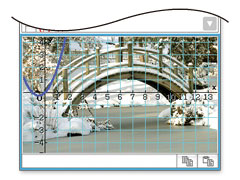
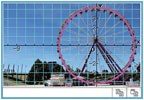
A graph screen with a visual appropriate for creating a graph of the selected function is displayed.
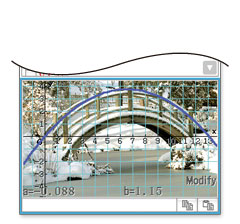
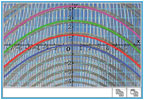
Congratulations! Your graph is complete.
![]()
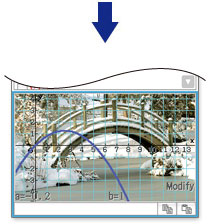
Change the graph by repeatedly changing coefficient to create a graph that visually matches the parabola.
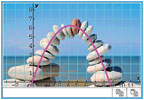
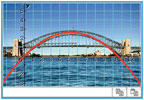
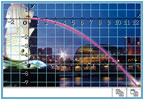
C2P files — Single images
Plotted C2P files can be used in Graph & Table, eActivity, Conics, Sequence, and Statistics.
©styf - Fotolia.com
©Phillip Minnis - Fotolia.com
©spinskin - Fotolia.com
©Steve Beckle - Fotolia.com
©Olivier G - Fotolia.com
©Juha-Pekka Kervinen - Fotolia.com
More than 40 pictures are pre-loaded on the fx-CP400!
Graphing function
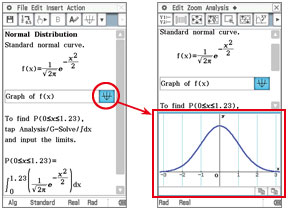
Display formulas and related graphs in the same color and highlight graphcharacteristics by displaying scale marks, grids, and coordinate values. The vivid colordisplay of the fx-CP400 improves the visibility of graphs and formulas.
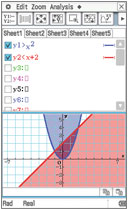
Area of inequality shading,
grid lines, numbers on axes

A different color for
each graph and figure
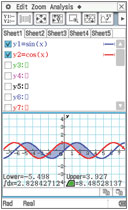
∫dx intersection
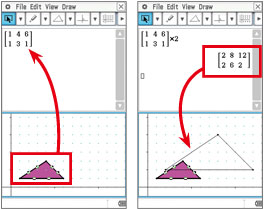
Geometry
Students can learn general theorems by drawing figures. Dropping a geometricfigure into the Main application window will produce the numerical data for thefigure. An Animation function enables students to move geometric figures drawn onthe screen. The fx-CP400 supports drawing of conics using a focus.
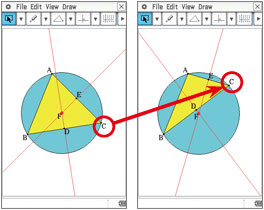
Geometric graphing
Geometric graphing using drag & drop
Spreadsheet application
Collected data can be organized and tabulated for analysis after statistical graphingis complete. Spreadsheet data also can be used in table calculations. In addition, thefx-CP400 supports the following functions: search, sort, data import from and exportto lists, matrices, and variables, CellIf, and Histogram/Box-whisker graphing.
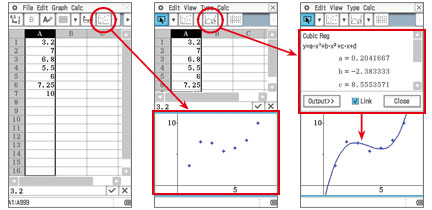
Color Link
The fx-CP400 features the Color Link function, which automatically links colors specified on the spreadsheet screen with colors used in graphs to support learning of functions by enabling visual confirmation of changes in values or trends.
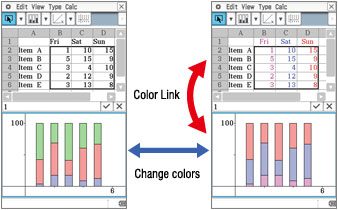
Use Color Link to link the color of text and graphs.
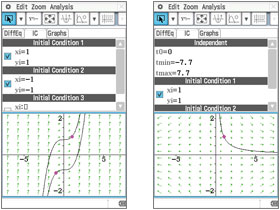
Differential Equation Graph application
The solution set of a differential equation can be represented graphically as a vectorfield, and solution curves can be drawn by providing initial conditions for theequation. First, second, and n-th order differential equations are supported.
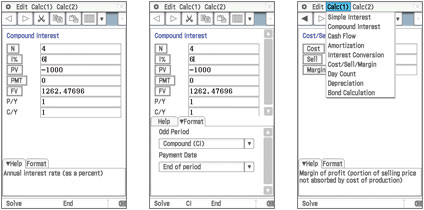
Financial application
This fx-CP400 application provides a total of 15 different financial calculations,including simple/compound interest, cash flow, amortization, depreciation, bondcalculation, and operating/financial leverage.
Specifications
ALGEBRA
- CAS (Computer Algebra System)
- Algebra Assistant
- Fractions
- Transformation (simplify, expand, factor)
- Function graphing, polar, parametric and x = f (y) equations
- Numeric evaluation of functions in tables
- Graph solve (root, max, intersection, inflection, distance)
- Conics graphs (Parabola, Circle, Ellipse, Hyperbola, General figure)
- Conics graph solve (Focus, Vertex, Directrix, Symmetry, Center, Radius)
- Recursive and explicit sequence numerical tables and plots
- Number Base (base 2 (Bin), 8 (Oct), 10 (Dec) and 16 (Hex))
- Laplace transform, Fourier transform, Fast Fourier transform (FFT)
CALCULUS
- Hyperbolics
- Integration, Differential
- Differential equation
- Σ, ∏, lim
- Dirac Delta, Heaviside Unit Step, Gamma
STATISTICS
- Statistical plot (Scatter Plot, xyLine, Normal Probability Plot, Histogram, Box-whisker plot)
- Statistical regression graphs
GEOMETRY
eACTIVITY APPLICATION
HARDWARE
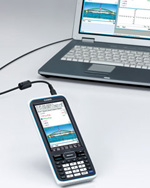
- Data communication (via USB and 3-pin cables)
- USB cable for connecting with PC
- 3-pin cable for connecting with other ClassPad unit or EA-200
OTHER USEFUL FEATURES
- Graphing function
- Drag & drop
- Natural format input of equations and expressions
- Natural format display of results
- Math, Alphabet, 2D soft keyboards
- Command catalogue soft keyboard
- Shift key configuration
- Calculation History
- Mantissa + exponent: 10 + 3
- Interactive manipulation for solving equations
- Differential equation graphs
- Numeric equation solver
- Financial calculations
- Icon menus
- Full screen display/Split screen display
- Software upgradeability (maintenance, feature upgrades)
- User-defined variable
- User-defined function (extends built-in functions)
- Folder-based memory management
- Resetting/Initializing memory
- Selectable display language
- Auto Power Off (APO)
- Bundled Screen Receiver Software
- Ending Screen/User-defined Ending Screen
- Graph & Picture
- Horizontal screen view
- Length unit
OPTIONS
- ClassPad Manager (FA-CP400A/B)
- EA-200 Data Analyzer
-
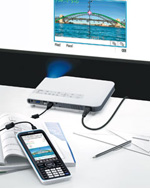
USB direct connection to CASIO Data Projector ∗
∗ For information on supported models, refer to the following URL:
http://edu.casio.com/support/projector/en/
-
Simple data management using the mass storage function
Specifications
-
Programmable
-
 3D Graph
-
 Computer Algebra System With CAS Graphic calculators you can use symbolic as well as numerical expressions. CAS is Computer Algebra System.
-
 Color display
-
 Memory : 500KB
-
 Natural textbook display Display expression same as textbook.
-
 10 + 3 digits 10-digit mantissa + 3-digit exponential display.
-
 Dot matrix display High-resolution screen provides beautiful looking graphs every time.
-
 Icon menu Specify the operation you want to perform by selecting an icon or inputting a number.
-
 Multi-replay Quick and easy recall of previously executed formulas for editing and re-execution.
-
 Plastic keys Designed and engineered for easy operation.
-
 List based STAT-data editor Viewing and editing of input data in list format, showing data groups (x-data, y-data, frequency) and surrounding data.
-
Basic Statistics Standard statistics functions such as Mean, SUM, Standard Deviation, and Regression
-
Basic Mathematical Functions Trigonometric, Exponential logarithmic, etc.
-
Table Generation You can create a numerical table based on that expression by registering a function expression. In addition, graph functions can be represented by graphs.
-
Data Logger You can obtain data log of scientific experiments.
-
Intermediate Statistics More statistical functions such as Paired-variable statistical calculation, Quartiles and List display functions for speedy and thorough learning .
-
Base-n calculation Binary/Octal/Hexadecimal
-
Scientific Constants You can use constant symbols used in physics, science classes.
-
Financial Financial functions are built in, making financial calculations easy.
-
Graphing
-
Vector
-
Advanced Statistics Support high level statistics by 7 kinds of advanced distribution calculation.
-
Inequality
-
 Data communication with a personal computer Allows data communication with a personal computer.
-
AAA-size Battery
-
Differentiation
-
Spreadsheet
-
Connection to PC
-
Touch Panel
-
Matrix
-
Equation
-
Integration
-
High Resolution We are choosing a model with higher definition in our non-programmable model and a higher definition model with Programmable model.
-
Metric Conversions You can convert a number in one unit to a number in a different unit.
-
Complex number calculation
Recommended


Related Links

CASIO Calculators Global

Education

CALCULATOR ADVENTURE ISLAND (for Kids)

Accessories and options
History of CASIO's Electronic Calculator Business