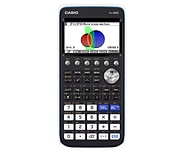
fx-CG20
- The colors may differ slightly from the original.
Product Overview
fx-CG20
3D Graph
Color display
AP / SAT / SAT Subject / PSAT / NMSQT / ACT / IB
Suitable for AP, SAT, SAT Subject, PSAT, NMSQT, ACT & IB examinations.
Number of Functions : Over 2900
Natural textbook display
Display expression same as textbook.
Features

* Comes with snap-on hard case.
More Colorful and Clear Graphic Expression
A next-generation color model that carries on the tradition of innovation in CASIO graphic scientific calculators!
Graphical color display!
Vivid colors and smooth fonts for easily readable graphs and formulas!
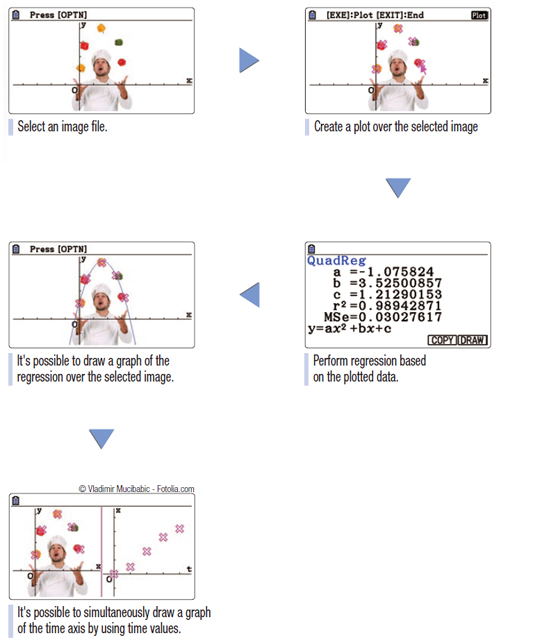
Picture Plot
Create function graphs overlaid on color images!
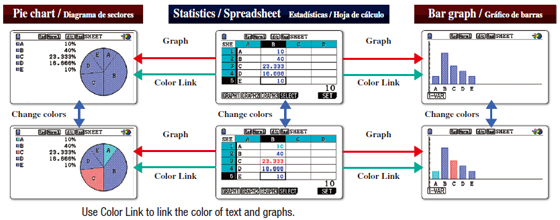
Color Link
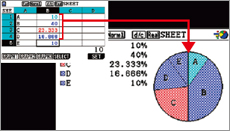
Automatically links colors of values on the spreadsheet screen with colors used in graphs!
The innovative color display dramatically increases math learning efficiency.
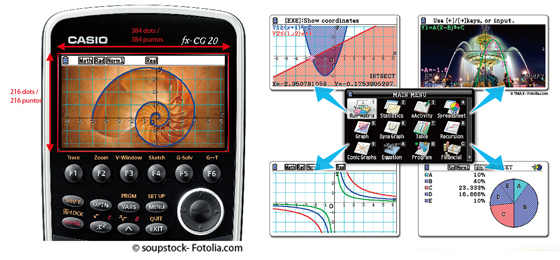
Graphical Color Display
The color display, with more than 65,000 colors (384 x 216 pixels), is capable of rendering in crisp, clear colors line, pie, and bar graphs as well as minute details such as graph gridlines and coordinate axis labels and coordinate values displayed during tracing. In addition, the display features a high-quality LCD panel that delivers excellent visibility and low power consumption and enables long run time of approximately 140 hours from four AAA alkaline batteries.
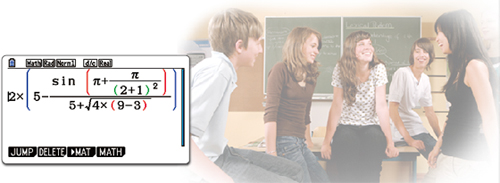
Easy-to-read Fonts
The fx-CG20 comes with smooth, easy-to-read fonts with character definition of up to 18 x 24 dots that clearly display mathematical equations and other text. Furthermore, the calculator automatically color codes brackets to facilitate the input of complex equations with multiple brackets and improve equation viewability.
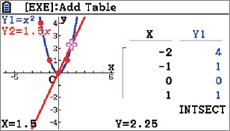
Color Link
The fx-CG20 features the Color Link function, which automatically links colors specified on the spreadsheet screen with colors used in graphs to support learning of functions by enabling visual confirmation of changes in values or trends.
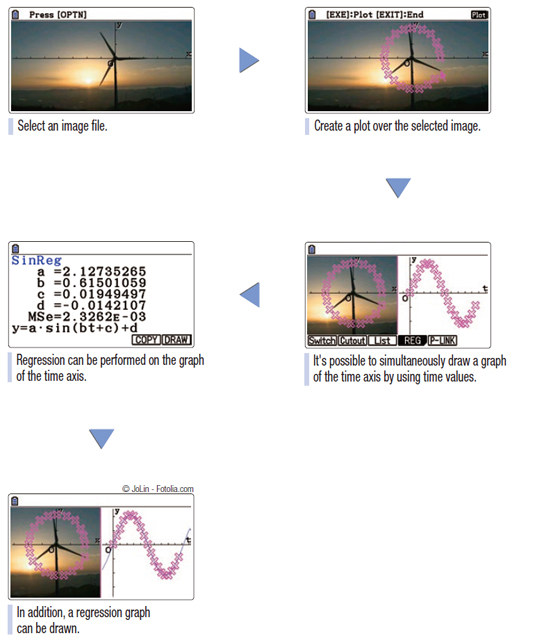
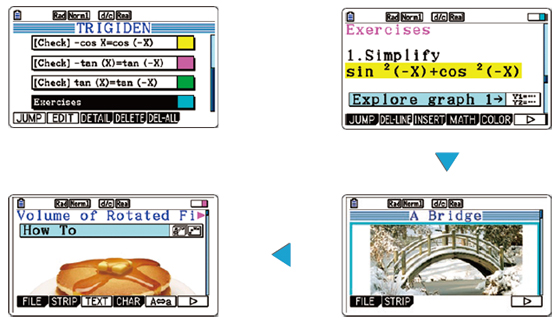
Single image and multiple images make learning interesting and fun.
The calculator comes pre-loaded with visuals such as a single image (still image) of the curve of an arched bridge and multiple images (sequential images) of the rotation of windmill blades. The use of real-life visuals as background images for functions such as the drawing of graphs overlaid on color images makes mathematics learning a more visually familiar experience.
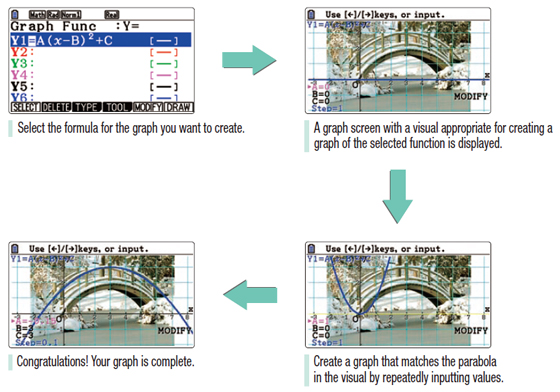
Graphing
Students can create a wide variety of graphs over real-life visual backgrounds.
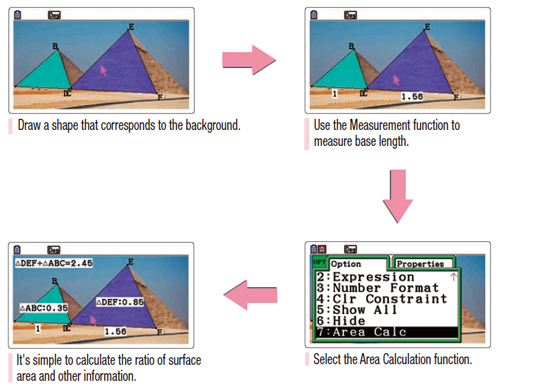
Geometry
The use of real-life visuals makes it fun and easy to study various aspects of geometry, including the drawing of shapes, movement, and similarity relations.
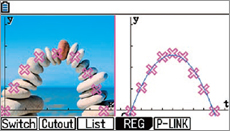
Picture Plot
Students can search for and plot curves found in nature and their surroundings. Analysis of the plotted data deepens understanding of the function.
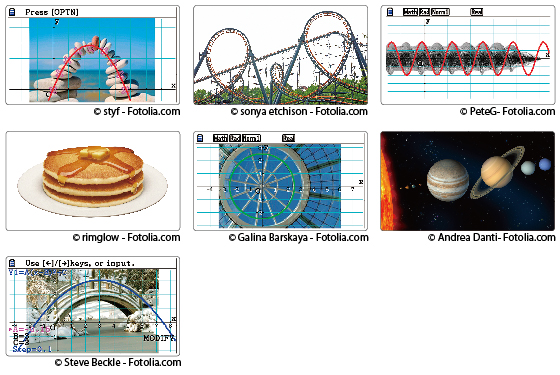
More than 50 pictures are pre-loaded on fx-CG20!!
G3P files — Single images
Plotted G3P files can be used in Graphing , Geometry , Picture Plot , and eActivity.
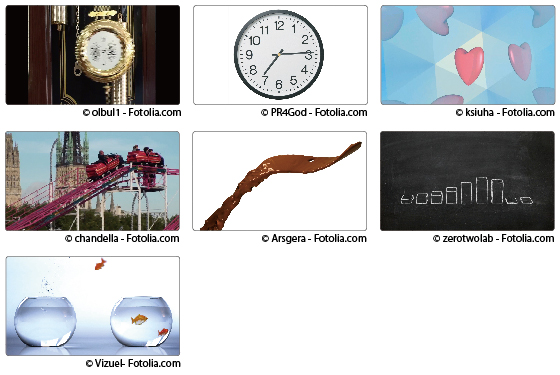
G3B files — Multiple images
Plotted G3B files can be used in Picture Plot.
Includes Many Basic Calculator Functions
Natural textbook display!
CASIO's original "Natural Expression Input Display" and "Natural Expression Output Display" make it possible to display fractions, exponents, logarithms, powers, and square roots just as they are written in the textbook. The result is enhanced student comprehension and improved math class efficiency.
Natural Input
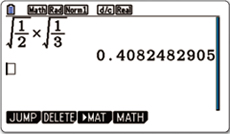
Input expressions and arithmetic operations as they appear in written form.
Natural Output
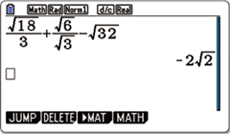
Calculation results appear in the same format as they are written.
New functions that make studying mathematics more rewarding and fun
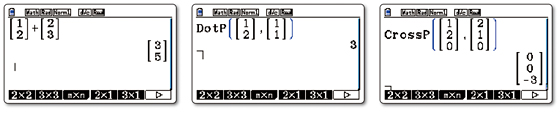
Vector Calculation
Perform operations on vectors and calculate the inner product and outer product.
Integral calculation improvement
Verify the integral value in real time while freely moving the interval using the cursor key.
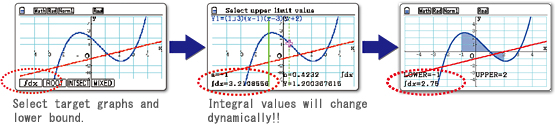
New integral calculation function
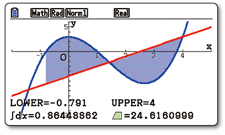
Calculate the values of integrals and the area enclosed by two graphs.
Not only arbitrary points, but also points of intersectionand the points where Y=0 can be selected in the intervalof integration.
New deviation commands
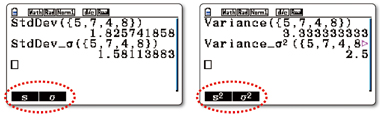
Population standard deviationand population variance commands have been added.
Random sampling of an existing list
Use shuffling or random selection to select data from an existing list and prepare new list data. Use the new list data to verify various statistical patterns
Auto parenthesis addition
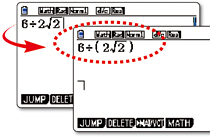
This function clearly indicates the calculationorder when the calculation priority sequence is ambiguous.
Equation application improvement
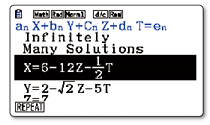
The calculation result display has been improvedfor simultaneous equations with an infinitely number of solutions.
eActivity
fx-CG20 calculator come with the same eActivity capabilities that originally appeared on the ClassPad 330. Now teachers as well as students can create their own problems and study materials. Students get the opportunity to learn at their own pace for more efficient study both at school and at home. eActivity is a great motivator for learning and understanding.
Other Features
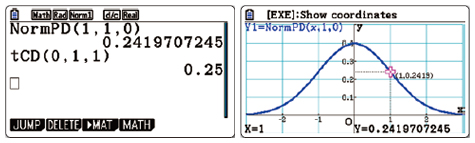
Probability
Normal distribution, Student's t-distribution, and other often-used statistical calculations are provided in function format for easier practical application.
List-based Statistics
Store a list of values in memory for use when performing function and statistical calculations, when drawing graphs, or when generating tables of numeric values.
Advanced Statistics
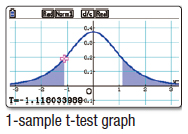
Perform tests, confidence interval, probability distribution, and other calculations and graphing.
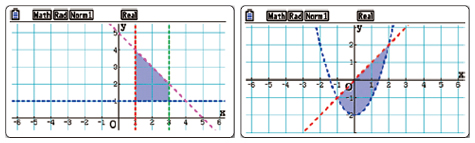
Inequality Graphing
New support for graphing the inequality of an x=Constant graph and x=f (y) graph allows study of the area for which the x-range is defined.
Financial Calculations
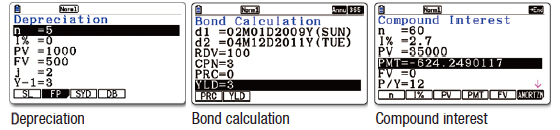
- Depreciation
- Bond calculation
- Simple interest
- Compound interest
- Investment appraisal (cash flow)
- Amortization
- Interest rate conversion (annual percentage rate and effective interest rate)
- Cost, selling price, or margin
- Day or date calculations
Built-in Software
Spreadsheet
A multi-function spreadsheet with built-in graphing capabilities is a valuable tool for table calculation lesson exercises.
E-CON2
E-CON2 provides total control over the optional EA-200 Data Analyzer.
It makes it possible to measure changes in temperature, sound, or speed using the EA-200 without any troublesome settings or program input.
Add-in Software
Pre-installed Software
Pre-installed add-in software comes installed on the calculator when you purchase it. You can use such software as-is, or you can delete it to free up memory.
Geometry
Picture Plot
Conversion
Physium
Probability Simulation *
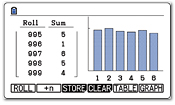
Simulate probability events using dice roll, coin toss,or card draw and perform statistical analysis.
Coin Toss
Marble Grab
Dice Roll
Card Draw
Spinner
Random Numbers
* Downloading from the Web and user installation is required.
Enhance your lesson plans by linking the calculator to various devices.
Peripherals
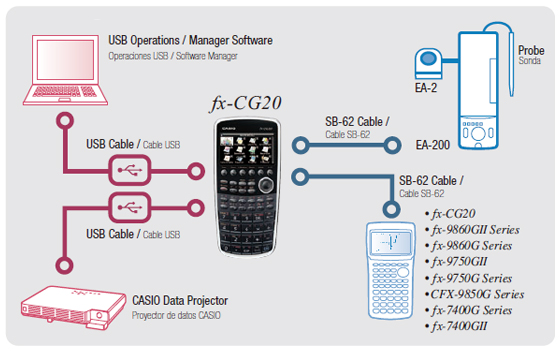
Out-of-the-box USB Operations
The fx-CG20 has a mass storage feature that makes it easy to transmit data to a personal computer like a USB flash memory device. Program-Link software is not required. (USB cable included)
System Requirements:
Operating Systems: Windows
®
7 (32-bit / 64-bit), Windows Vista
®
(32-bit), Windows
®
XP (32-bit), Mac OS
®
X (10.5.6 or later, 10.6.2 or later)
Connect the calculator to a data projector and project the calculator screen.
Connect the calculator to a CASIO Data Projector. Projecting graphs and equations on a large screen makes mathematics easier to teach and easier to learn.
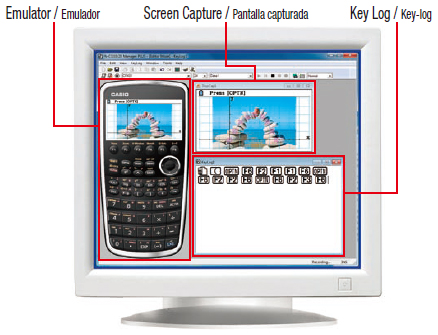
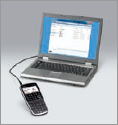
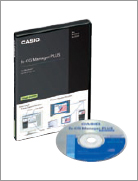
Manager Software fx-CG Manager PLUS. FA-CG1A Ver.1.0 for Windows
Main features
・fx-CG20 Calculator Emulation
Mimics fx-CG20 calculator operation using a computer mouse and keyboard
・Key-Log Editor
Key-Log auto play of recorded key operations
・Step playback Emulator LCD Screen Capture Screen Receiver
System Requirements: Operating Systems:
Windows
®
XP Home Edition, Windows
®
XP Professional (32-bit), Windows Vista
®
(32-bit) , Windows
®
7 (32-bit / 64-bit)
-
* For Windows Vista, operation is supported for 32-bit versions only. 64-bit versions are not supported.
Specications
Basic Functions
- Angle unit, Angle unit conversion (Deg, Rad, Grad)
- Trigonometric functions, Inverse trigonometric functions
- Hyperbolic functions, Inverse hyperbolic functions
- Exponent functions, Logarithmic functions
- Power functions (square root, cubic root, square, power, radical root)
- Coordinate conversion (Pol, Rec)
- Combination/Permutation ( n C r , n P r )
- Factorial, Inverse, random numbers, Fractions
- Logical operations
- Sexagesimal ↔ Decimal conversion
- Matrix calculations
- Complex number calculations
- Base- n calculations/conversions
- List data calculations
- Rounding
- Display format
- Unit Conversion (pre-installed software)
- Engineering symbol calculation
- Engineering notation
Graphing
- Rectangular coordinate graphing, Polar coordinate graphing
- Integration graph
- Parametric function graphing, Inequality graphing
- Trace, Zoom (box zoom, zoom in, zoom out, auto zoom)
- Table and Graph
- Dual Graph (table and graph, graph and graph)
- Sketch (tangent line, normal line, inverse function)
- Solve (root, minimum, maximum, intersection, integration)
- Dynamic graph
- Conic section graph
- Recursion graph
- Picture Plot (pre-installed software)
Calculus
- Derivatives, second derivatives, integrations
- Sigma feature
Statistics
- List-based one-variable and two-variable statistical analysis
- Statistical regression calculations
- Statistical plot (scatter plot, xyLine, normal probability plot, histogram, box plot)
- Statistical regression graphs (linear, med-med, quadratic, cubic, quartic, logarithmic, exponential, power, sinusoidal, logistic regression)
- Advanced statistical calculations: tests (Z-test, t-test, χ2-test, F-test, ANOVA), intervals (Z-interval, t-interval), distributions
- Pie chart
- Bar graph
eActivity
- eActivity creation and exploration
Other Features
- Natural format equation input
- Calculation history
- Spreadsheet and statistical plot
- Numeric equation solver, simultaneous equations, polynomial equations
- Financial calculations
- Programming
- Geometry (pre-installed software)
- Icon menu, full-screen/split-screen display
- Data communication
- User memory: 61,000 bytes, User Storage memory: 16 M bytes
Hardware
- Dimensions H x W x D (mm) : 20.6 x 89.5 x 188.5
- Approximate weight (g) : 230 (including batteries)
- Power supply : Four AAA-size alkaline batteries or four nickel-metal hydride batteries
- Approximate battery life (hours) : 140 (AAA-size alkaline batteries), 85 (nickel-metal hydride batteries) Assuming 5 minutes calculation and 55 minutes display per hour
- Dot matrix display : 216 x 384 dots
- Display capacity (characters) : 21 x 8
- Internal operation digits : 15
- Nested parentheses levels : 26
- Data communication : 3-pin cable, USB cable
- 3-pin serial port
- USB port
Specifications
-
Programmable
-
 3D Graph
-
 Color display
-
 AP / SAT / SAT Subject / PSAT / NMSQT / ACT / IB Suitable for AP, SAT, SAT Subject, PSAT, NMSQT, ACT & IB examinations.
-
 Number of Functions : Over 2900
-
 Natural textbook display Display expression same as textbook.
-
 10 + 2 digits 10-digit mantissa + 2-digit exponential display.
-
 Icon menu Specify the operation you want to perform by selecting an icon or inputting a number.
-
 Multi-replay Quick and easy recall of previously executed formulas for editing and re-execution.
-
 Plastic keys Designed and engineered for easy operation.
-
Basic Statistics Standard statistics functions such as Mean, SUM, Standard Deviation, and Regression
-
Basic Mathematical Functions Trigonometric, Exponential logarithmic, etc.
-
 Data communication with a personal computer Allows data communication with a personal computer.
-
Table Generation You can create a numerical table based on that expression by registering a function expression. In addition, graph functions can be represented by graphs.
-
Data Logger You can obtain data log of scientific experiments.
-
Intermediate Statistics More statistical functions such as Paired-variable statistical calculation, Quartiles and List display functions for speedy and thorough learning .
-
Base-n calculation Binary/Octal/Hexadecimal
-
Scientific Constants You can use constant symbols used in physics, science classes.
-
Financial Financial functions are built in, making financial calculations easy.
-
Graphing
-
Vector
-
Advanced Statistics Support high level statistics by 7 kinds of advanced distribution calculation.
-
 Metric conversion function You can convert a number in one unit to a number in a different unit.
-
 List based STAT-data editor Viewing and editing of input data in list format, showing data groups (x-data, y-data, frequency) and surrounding data.
-
AAA-size Battery
-
Differentiation
-
Spreadsheet
-
Connection to PC
-
Matrix
-
Equation
-
Integration
-
High Resolution We are choosing a model with higher definition in our non-programmable model and a higher definition model with Programmable model.
-
QR Code You can see graphs on smartphones etc. using QR Code.
-
Complex number calculation
Size of case / Total weight
- Dimensions (D × W × H) : 188.5×89.5×20.6mm
- Weight : 230g
Recommended


Related Links

CASIO Calculators Global

Education

CALCULATOR ADVENTURE ISLAND (for Kids)

Accessories and options

History of CASIO's Electronic Calculator Business